StatPecker
StatPecker transforms your data into stunning visuals, providing fast insights for effective storytelling and.
Visit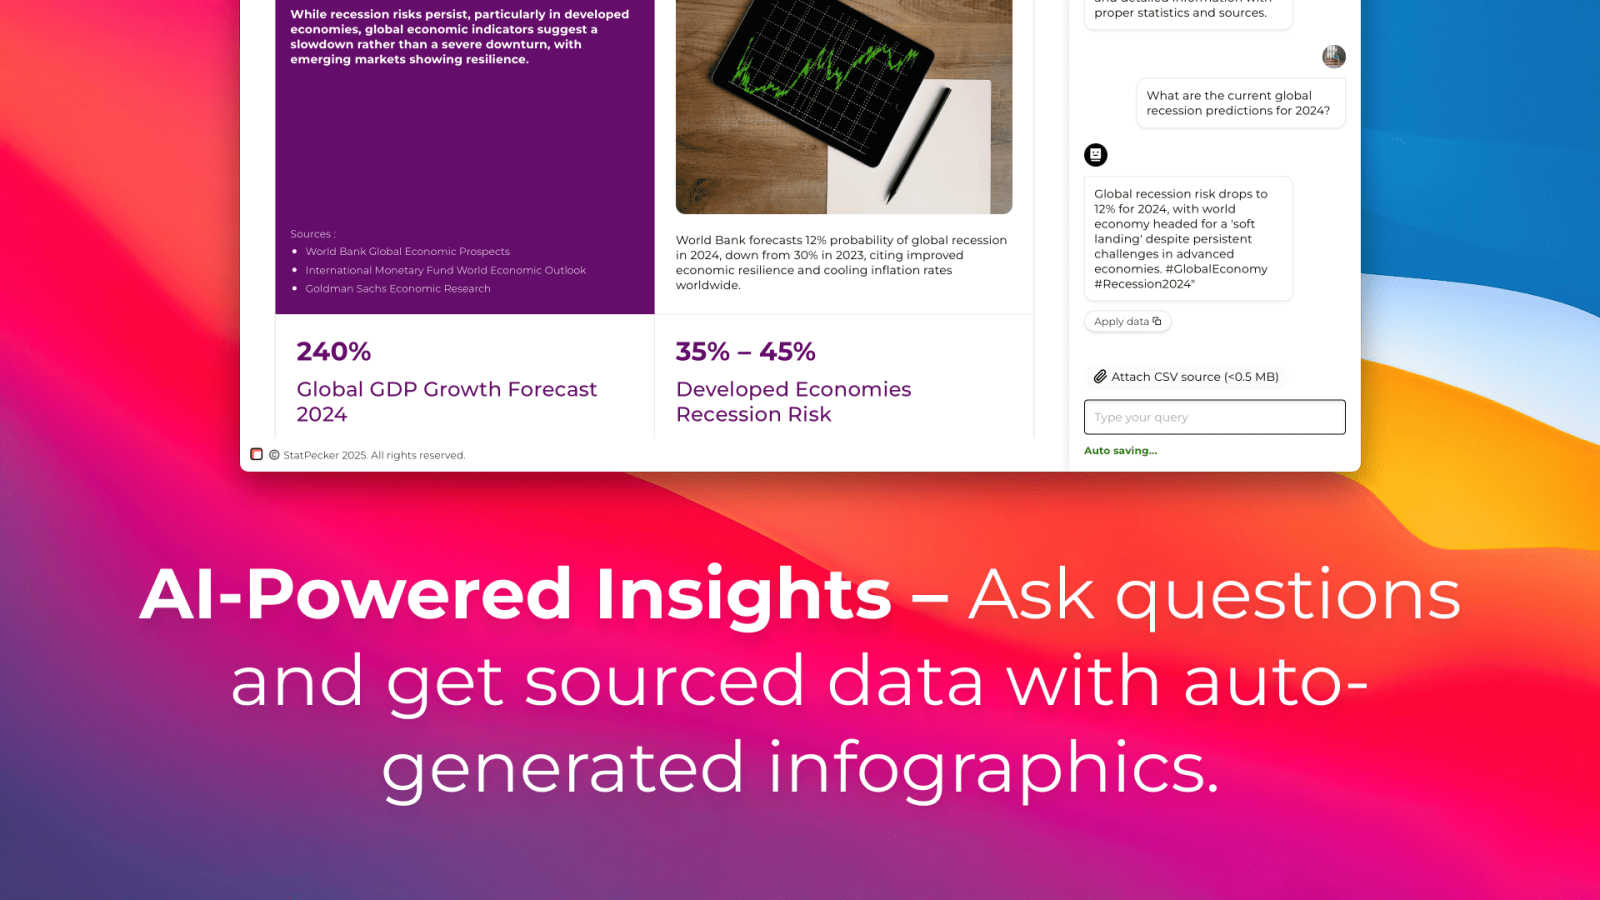
About StatPecker
StatPecker is an innovative AI-driven platform designed to transform raw data into captivating infographics within seconds. It simplifies the complex data storytelling process, making it accessible to a vast audience, including content creators, analysts, marketers, and educators. By harnessing the power of advanced artificial intelligence, StatPecker enables users to create striking visuals without needing extensive design skills or costly software. This tool significantly streamlines the traditional reporting processes, saving time and reducing costs, allowing users to focus on deriving insights from their data. With StatPecker, anyone can convert intricate data sets into engaging graphics that enhance understanding and retention, establishing it as an essential resource for effective communication of information.
Features of StatPecker
Local SQL Agent
The Local SQL Agent feature empowers users to upload CSV files (up to 50 MB) for private analysis. Everything runs on the user's device, ensuring that data remains confidential while generating insightful visuals. This feature allows for local queries and instant visualizations, making it easy to uncover trends without risking data privacy.
Ask Your Query
With the Ask Your Query feature, users can obtain instant insights from validated sources using AI. This feature eliminates the need for complex tools, allowing users to simply ask questions about their data and receive immediate, accurate answers in a visually appealing format, enhancing data-driven decision-making.
Publish & Embed
StatPecker allows users to make their visuals interactive and seamlessly integrate them into various platforms such as blogs, articles, and websites. This publish and embed feature ensures that users can share their findings effortlessly, fostering better communication and collaboration among teams and audiences.
Download & Use Anywhere
The Download & Use Anywhere feature enables users to export infographics as images suitable for reports, presentations, and more. This flexibility ensures that users can utilize their visuals across different formats and contexts, enhancing the reach and impact of their data storytelling.
Use Cases of StatPecker
Data Analysis for Businesses
StatPecker is ideal for businesses looking to analyze their performance metrics. Users can upload sales data to visualize trends and make data-driven decisions, enhancing overall business strategies and results.
Educational Presentations
Educators can utilize StatPecker to create engaging infographics for their presentations. By transforming complex information into visuals, teachers can enhance student understanding and retention of key concepts.
Marketing Campaign Reports
Marketers can leverage StatPecker to visualize the performance of their campaigns. By converting raw data into attractive graphics, they can effectively communicate results to stakeholders and improve future campaigns based on insights gained.
Research and Development
Researchers can benefit from StatPecker by visualizing their findings in a clear and concise manner. This tool allows them to present data effectively, facilitating better communication of their research outcomes to peers and the public.
Frequently Asked Questions
What types of files can I upload to StatPecker?
You can upload CSV files with a maximum size of 50 MB to StatPecker for analysis. This feature allows you to extract key insights from your data without the hassle of using spreadsheets.
Is my data safe when using StatPecker?
Yes, your data remains private and secure. The Local SQL Agent feature ensures that everything runs on your device, so your data is not shared or transmitted over the internet during analysis.
Do I need any design skills to create visuals with StatPecker?
No, StatPecker is designed for users without extensive design skills. The AI-driven platform simplifies the process of creating infographics, allowing anyone to produce professional-quality visuals effortlessly.
Can I integrate my visuals into my website?
Absolutely! StatPecker allows you to publish and embed your visuals seamlessly into blogs, articles, and websites, making it easy to share your insights with a wider audience.
Explore more in this category:
Similar to StatPecker
Decision support framework for high consideration businesses with mix of online and offline channels, content-rich sites, and long customer journeys.
AI motion graphics and map animation generator for content creators, editors, founders and marketers.
Reelry creates faceless TikTok reels in your brand's style, automating ideation and production for consistent, engaging content.
EnsembleData provides real-time APIs to scrape and analyze social media data at scale for businesses.
Ribbi automates your social media content creation, helping you grow your presence with AI-driven videos, visuals, and performance tracking.
Subiq is subscription management software that helps small teams track every tool and stop wasting money on unused software.