Skippership vs StatPecker
Side-by-side comparison to help you choose the right product.
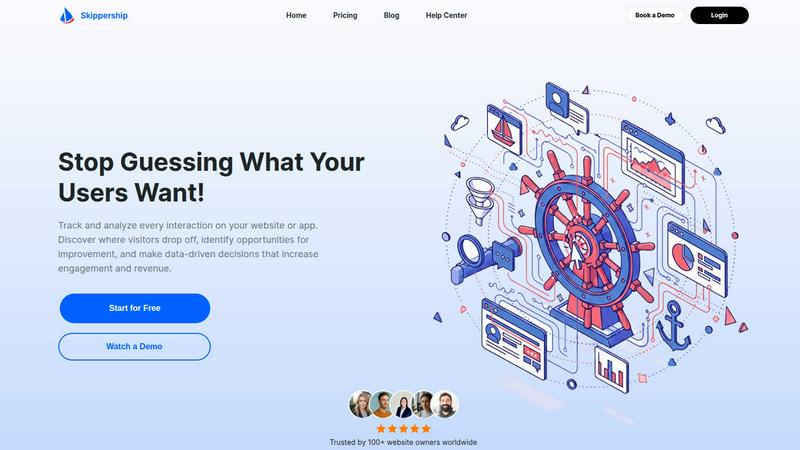
Skippership
Skippership uses AI to show where users get stuck so you can fix it and improve your site.
Last updated: March 1, 2026

StatPecker
StatPecker transforms your data into stunning visuals, providing fast insights for effective storytelling and.
Last updated: March 1, 2026
Visual Comparison
Skippership
StatPecker
Feature Comparison
Skippership
Session Replays
Watch exactly how your users experience your site with real user session recordings. This feature allows you to uncover friction points, usability issues, and conversion blockers by seeing the entire journey from the user's perspective. It provides a clear, unfiltered view of interactions, helping you take confident, data-driven actions to optimize the experience.
Interactive Heatmaps
See which parts of your pages get noticed and which are ignored with detailed heatmaps. Skippership's heatmaps visually display where users click, scroll, and spend time on your pages. By highlighting overlooked areas and popular elements, you can make informed decisions to optimize content layout and design, ultimately boosting engagement and increasing conversions.
Goal & Conversion Tracking
Know which user actions drive real business results by tracking key goals like signups, purchases, and button clicks. This feature helps you measure performance, uncover patterns in user behavior, and gain real-time insights into what truly motivates conversions. It turns abstract visits into measurable outcomes you can analyze and improve upon.
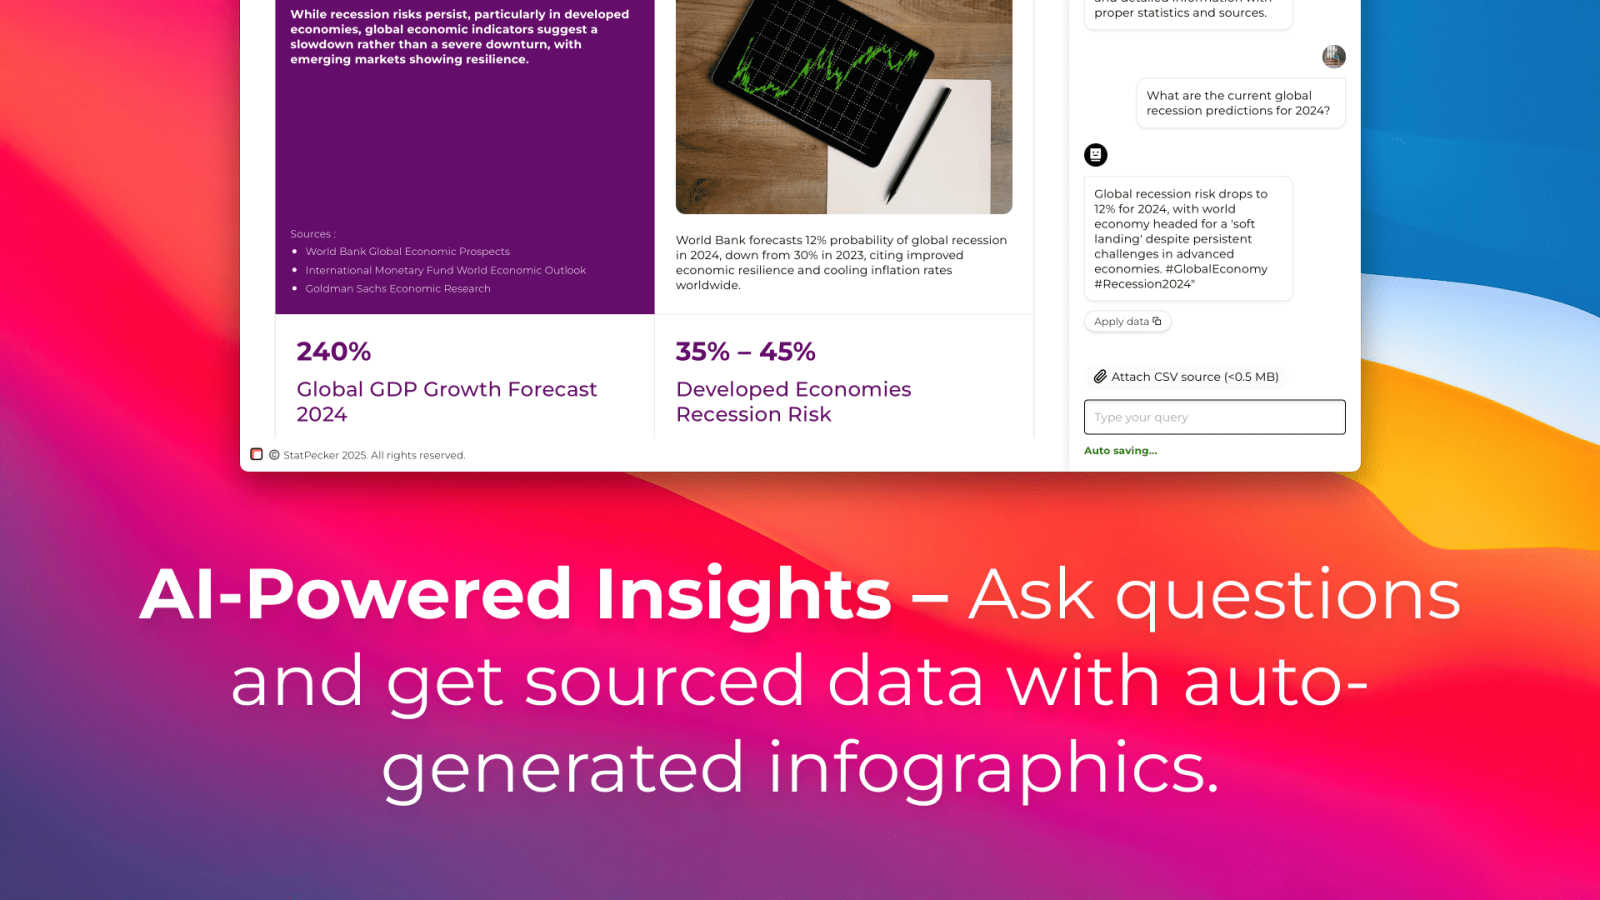
AI-Powered Insights
Turn vast amounts of data into clear, actionable insights with Skippership's AI analytics. This intelligent layer reviews session data, makes sense of complex user actions, and automatically identifies critical points where users get stuck. It goes beyond just showing data by suggesting practical solutions, helping you make faster, smarter decisions to boost engagement and retention.
StatPecker
Local SQL Agent
The Local SQL Agent feature empowers users to upload CSV files (up to 50 MB) for private analysis. Everything runs on the user's device, ensuring that data remains confidential while generating insightful visuals. This feature allows for local queries and instant visualizations, making it easy to uncover trends without risking data privacy.
Ask Your Query
With the Ask Your Query feature, users can obtain instant insights from validated sources using AI. This feature eliminates the need for complex tools, allowing users to simply ask questions about their data and receive immediate, accurate answers in a visually appealing format, enhancing data-driven decision-making.
Publish & Embed
StatPecker allows users to make their visuals interactive and seamlessly integrate them into various platforms such as blogs, articles, and websites. This publish and embed feature ensures that users can share their findings effortlessly, fostering better communication and collaboration among teams and audiences.
Download & Use Anywhere
The Download & Use Anywhere feature enables users to export infographics as images suitable for reports, presentations, and more. This flexibility ensures that users can utilize their visuals across different formats and contexts, enhancing the reach and impact of their data storytelling.
Use Cases
Skippership
Identifying Website Friction Points
Product and UX teams can use session replays and heatmaps to pinpoint exactly where users struggle, such as confusing navigation, unclickable elements mistaken for buttons, or forms that cause abandonment. This direct observation replaces assumptions, providing a factual basis for design and usability improvements.
Optimizing Conversion Funnels
Marketing and growth teams can implement goal tracking to monitor key steps in their conversion funnel. By analyzing where potential customers drop off in the signup or checkout process, teams can test and implement changes to streamline the journey, remove obstacles, and systematically increase conversion rates.
Improving Content & Page Layout
Content managers and web designers can utilize scroll and click heatmaps to understand how visitors engage with their pages. This reveals which content sections are read, which calls-to-action are effective, and which areas are ignored, enabling data-backed optimizations to layout and content placement for better engagement.
Validating New Features & Designs
Before and after launching a new feature or redesign, teams can use Skippership to gather concrete behavioral data. Session replays show real user interactions with the new element, while goal tracking measures its impact on key metrics, providing clear evidence of success or highlighting needed adjustments.
StatPecker
Data Analysis for Businesses
StatPecker is ideal for businesses looking to analyze their performance metrics. Users can upload sales data to visualize trends and make data-driven decisions, enhancing overall business strategies and results.
Educational Presentations
Educators can utilize StatPecker to create engaging infographics for their presentations. By transforming complex information into visuals, teachers can enhance student understanding and retention of key concepts.
Marketing Campaign Reports
Marketers can leverage StatPecker to visualize the performance of their campaigns. By converting raw data into attractive graphics, they can effectively communicate results to stakeholders and improve future campaigns based on insights gained.
Research and Development
Researchers can benefit from StatPecker by visualizing their findings in a clear and concise manner. This tool allows them to present data effectively, facilitating better communication of their research outcomes to peers and the public.
Overview
About Skippership
Skippership is a foundational user behavior analytics platform designed to replace guesswork with clarity. At its core, it provides businesses, product managers, UX designers, and marketers with the essential tools needed to understand how people interact with their website or application. The platform consolidates critical analytics functions—like session recordings, heatmaps, and conversion tracking—into a single, intuitive dashboard. This unified approach offers complete visibility into the user journey, allowing teams to see precisely where visitors encounter friction, drop off, or succeed. What makes Skippership particularly effective is its integrated AI analytics layer. This intelligent system reviews complex session data, automatically identifies critical usability issues, and suggests actionable solutions. By transforming raw behavioral data into clear, understandable insights, Skippership empowers teams to make confident, data-driven decisions that improve user experience, increase engagement, and boost conversion rates. It is built to be accessible, with a no-code setup that gets you started in minutes, and is designed with a strong commitment to security and privacy compliance.
About StatPecker
StatPecker is an innovative AI-driven platform designed to transform raw data into captivating infographics within seconds. It simplifies the complex data storytelling process, making it accessible to a vast audience, including content creators, analysts, marketers, and educators. By harnessing the power of advanced artificial intelligence, StatPecker enables users to create striking visuals without needing extensive design skills or costly software. This tool significantly streamlines the traditional reporting processes, saving time and reducing costs, allowing users to focus on deriving insights from their data. With StatPecker, anyone can convert intricate data sets into engaging graphics that enhance understanding and retention, establishing it as an essential resource for effective communication of information.
Frequently Asked Questions
Skippership FAQ
What kind of data does Skippership collect?
Skippership collects anonymized behavioral data to understand how users interact with your site. This includes click, scroll, and movement data, session recordings, and aggregated interaction patterns. We are committed to privacy and do not process personal or sensitive user information, aligning with standards like GDPR and CCPA.
How does the AI analytics feature work?
The AI analytics layer automatically processes the behavioral data collected from session replays and heatmaps. It identifies common patterns, detects anomalies like rage clicks or sudden drop-offs, and surfaces these critical insights with actionable suggestions. This helps you quickly understand complex user behavior without manually sifting through hours of recordings.
Is Skippership difficult to set up?
No, Skippership is designed for a no-code, fast setup. You can typically get started in just a few minutes by adding a small snippet of JavaScript code to your website. The platform is user-friendly and built for teams of all technical skill levels, requiring no extensive training or IT support to begin generating insights.
How does Skippership ensure data security and privacy?
Security and privacy are foundational. All data is transmitted and stored using SSL/TLS encryption on secure, reliable cloud infrastructure. Skippership is built to comply with major privacy regulations like GDPR and CCPA. We only collect the data necessary for analytics and never process personal identifiers, keeping user privacy a top priority.
StatPecker FAQ
What types of files can I upload to StatPecker?
You can upload CSV files with a maximum size of 50 MB to StatPecker for analysis. This feature allows you to extract key insights from your data without the hassle of using spreadsheets.
Is my data safe when using StatPecker?
Yes, your data remains private and secure. The Local SQL Agent feature ensures that everything runs on your device, so your data is not shared or transmitted over the internet during analysis.
Do I need any design skills to create visuals with StatPecker?
No, StatPecker is designed for users without extensive design skills. The AI-driven platform simplifies the process of creating infographics, allowing anyone to produce professional-quality visuals effortlessly.
Can I integrate my visuals into my website?
Absolutely! StatPecker allows you to publish and embed your visuals seamlessly into blogs, articles, and websites, making it easy to share your insights with a wider audience.
Alternatives
Skippership Alternatives
Skippership is a user behavior analytics platform. It belongs to the category of tools that help businesses understand how people interact with their website or app. By combining recordings, heatmaps, and AI, it shows exactly where users encounter problems. People often look for alternatives for practical reasons. This could be due to budget constraints, a need for different specific features, or because their website is built on a particular platform like Shopify or WordPress that requires a specialized integration. The scale of their business and their team's technical skill also play a big role in the decision. When evaluating other options, focus on the core fundamentals. You need a tool that reliably captures user sessions and provides clear visual data like heatmaps. Consider how easy it is to use and understand the insights. Finally, ensure it fits your technical environment and offers the specific analysis types your team needs to make confident improvements.
StatPecker Alternatives
StatPecker is an innovative AI-powered tool within the analytics and data category, designed to convert raw data into visually appealing infographics almost instantly. It helps users, including content creators, analysts, marketers, and educators, simplify the data storytelling process without needing extensive design skills. As a result, many users actively seek alternatives to StatPecker to explore different pricing options, features that may better suit their specific needs, or platforms that integrate more seamlessly with their existing workflows. When looking for an alternative to StatPecker, users should consider several factors. These include the ease of use, the quality of visual outputs, the availability of customizable features, and the overall cost. Additionally, it is essential to evaluate the level of customer support provided and how well the tool can integrate with other software commonly used in data analysis and reporting.