Fusedash vs StatPecker
Side-by-side comparison to help you choose the right product.
Fusedash transforms raw data into intuitive dashboards and charts, enabling your team to act on insights swiftly.
Last updated: March 4, 2026

StatPecker
StatPecker transforms your data into stunning visuals, providing fast insights for effective storytelling and.
Last updated: March 1, 2026
Visual Comparison
Fusedash

StatPecker
Feature Comparison
Fusedash
Flexible Views
Fusedash provides a versatile platform where users can create tailored dashboard views for different audiences. This feature enables stakeholders to visualize the data in formats that are most relevant to them—whether through dashboards, charts, maps, or narrative reports. By allowing teams to customize layouts, filters, and time ranges, Fusedash ensures that everyone sees the information that matters most without unnecessary back and forth.
AI Chart Generator
The AI Chart Generator feature allows users to quickly create clear and engaging visuals from their datasets, whether sourced from CSV files or APIs. In mere minutes, users can select the appropriate chart type, apply comparisons, and refine labels, ensuring that each chart effectively communicates the intended story. This tool not only accelerates visual creation but also facilitates the reuse of charts across different dashboards and reports.
Dashboard Software
Fusedash offers a comprehensive workspace for both dashboards and reports, integrating performance views with contextual storytelling. This feature ensures that users can monitor key performance indicators while also understanding the narratives behind the data. By providing a seamless blend of visuals and insights, teams can maintain alignment and reduce discrepancies in reporting.
AI Chat
The AI Chat functionality enables users to interact with their data in a conversational manner. By asking questions in plain language, users can swiftly explore breakdowns and receive intelligent suggestions for the best metrics and visualizations. This interactive feature not only makes data exploration more intuitive but also allows users to transform insights into shareable dashboard views quickly.
StatPecker
Local SQL Agent
The Local SQL Agent feature empowers users to upload CSV files (up to 50 MB) for private analysis. Everything runs on the user's device, ensuring that data remains confidential while generating insightful visuals. This feature allows for local queries and instant visualizations, making it easy to uncover trends without risking data privacy.
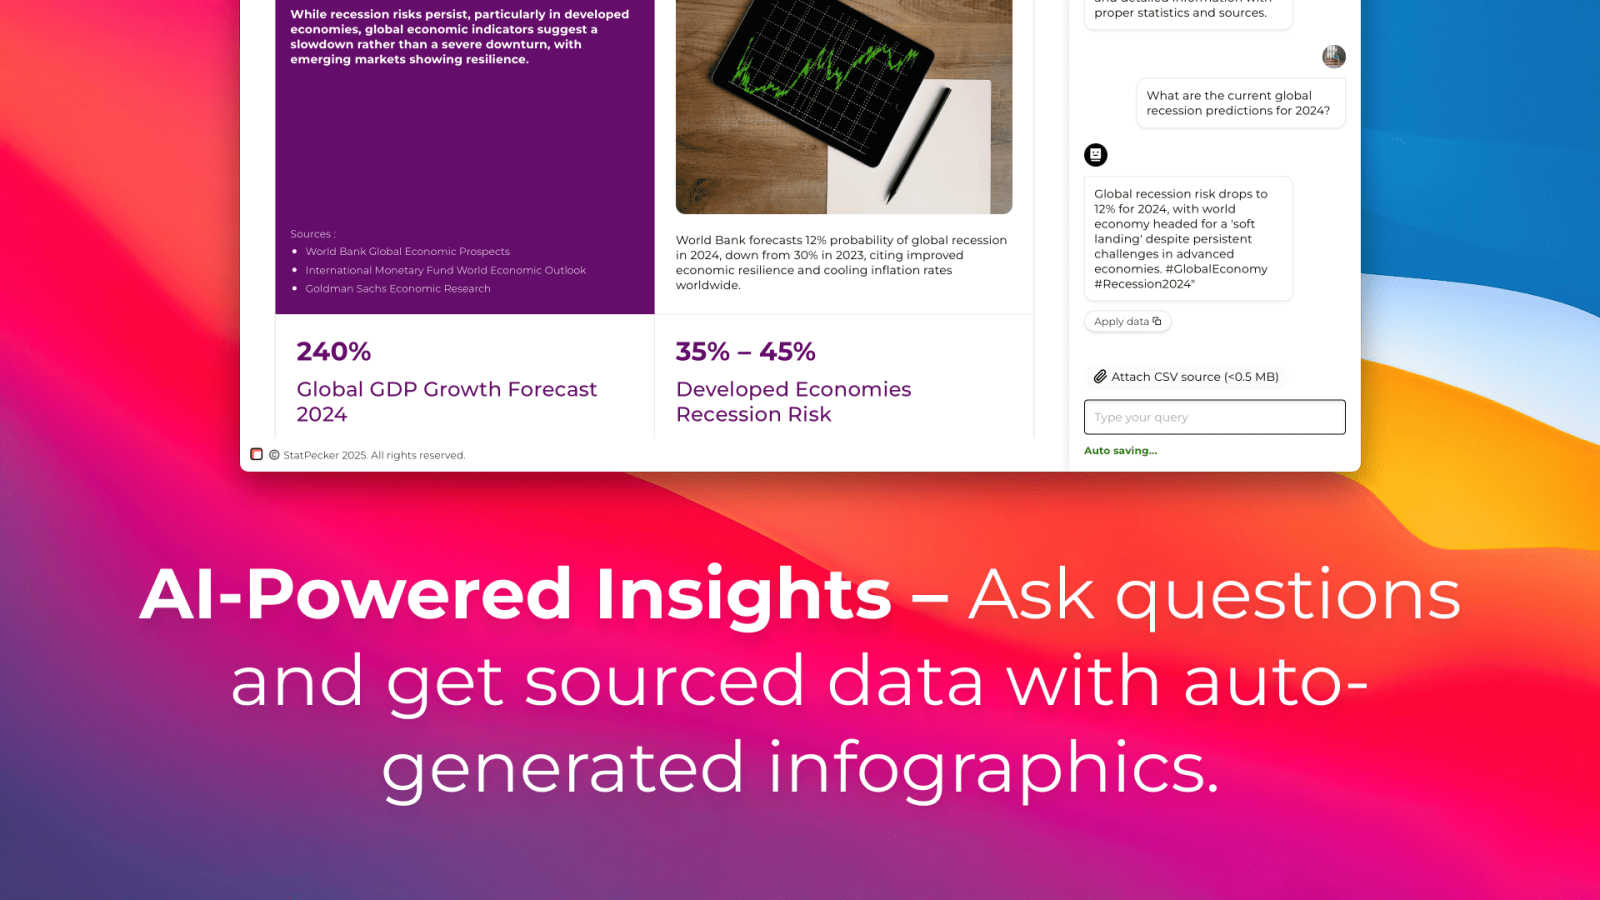
Ask Your Query
With the Ask Your Query feature, users can obtain instant insights from validated sources using AI. This feature eliminates the need for complex tools, allowing users to simply ask questions about their data and receive immediate, accurate answers in a visually appealing format, enhancing data-driven decision-making.
Publish & Embed
StatPecker allows users to make their visuals interactive and seamlessly integrate them into various platforms such as blogs, articles, and websites. This publish and embed feature ensures that users can share their findings effortlessly, fostering better communication and collaboration among teams and audiences.
Download & Use Anywhere
The Download & Use Anywhere feature enables users to export infographics as images suitable for reports, presentations, and more. This flexibility ensures that users can utilize their visuals across different formats and contexts, enhancing the reach and impact of their data storytelling.
Use Cases
Fusedash
Marketing Performance Monitoring
Marketing teams can leverage Fusedash to create dashboards that track campaign performance across multiple channels. By visualizing engagement metrics and conversion rates in real-time, teams can make informed decisions about where to allocate resources and which strategies to optimize.
Financial Reporting
Finance departments can utilize Fusedash to compile comprehensive financial reports that integrate data from various sources. With the ability to create interactive charts and narrative insights, stakeholders can easily grasp the financial health of the organization and identify areas for improvement.
Sales Pipeline Management
Sales teams can benefit from Fusedash by utilizing its visualization capabilities to monitor sales pipelines. By visualizing key metrics such as lead conversion rates and sales forecasts, teams can identify trends and adjust their strategies to maximize revenue.
Operations Performance Analysis
Operations teams can use Fusedash to analyze performance metrics across different departments. By creating dashboards that visualize operational efficiency and productivity, teams can pinpoint areas for enhancement and align their efforts towards achieving organizational goals.
StatPecker
Data Analysis for Businesses
StatPecker is ideal for businesses looking to analyze their performance metrics. Users can upload sales data to visualize trends and make data-driven decisions, enhancing overall business strategies and results.
Educational Presentations
Educators can utilize StatPecker to create engaging infographics for their presentations. By transforming complex information into visuals, teachers can enhance student understanding and retention of key concepts.
Marketing Campaign Reports
Marketers can leverage StatPecker to visualize the performance of their campaigns. By converting raw data into attractive graphics, they can effectively communicate results to stakeholders and improve future campaigns based on insights gained.
Research and Development
Researchers can benefit from StatPecker by visualizing their findings in a clear and concise manner. This tool allows them to present data effectively, facilitating better communication of their research outcomes to peers and the public.
Overview
About Fusedash
Fusedash is an innovative AI-powered data visualization platform designed to streamline how teams analyze and present their data. By transforming connected data into insightful visual representations, Fusedash enables organizations to create decision-ready dashboards, interactive charts, detailed maps, and comprehensive narrative reports all within a single workspace. This unified approach eliminates the need to duplicate logic across various disconnected tools, driving consistency and efficiency. The core value proposition of Fusedash lies in its ability to allow users to define key metrics and KPIs just once, ensuring that everyone across the organization—from leadership to marketing to operations—accesses the same trusted data. This consistency helps teams move beyond tedious manual reporting cycles and conflicting narratives, empowering them to monitor real-time information while gaining insights into the reasons behind the data. With integrated AI features like natural language data chat and smart visualization assistance, Fusedash simplifies data exploration and reporting, turning raw data into a shared source of truth that fosters alignment and informed decision-making.
About StatPecker
StatPecker is an innovative AI-driven platform designed to transform raw data into captivating infographics within seconds. It simplifies the complex data storytelling process, making it accessible to a vast audience, including content creators, analysts, marketers, and educators. By harnessing the power of advanced artificial intelligence, StatPecker enables users to create striking visuals without needing extensive design skills or costly software. This tool significantly streamlines the traditional reporting processes, saving time and reducing costs, allowing users to focus on deriving insights from their data. With StatPecker, anyone can convert intricate data sets into engaging graphics that enhance understanding and retention, establishing it as an essential resource for effective communication of information.
Frequently Asked Questions
Fusedash FAQ
What types of data can I connect to Fusedash?
Fusedash allows users to connect a variety of data sources, including CSV files, APIs, and public datasets. This flexibility enables users to consolidate their data into a unified platform for comprehensive analysis and reporting.
How does Fusedash ensure data consistency across reports?
Fusedash promotes data consistency by allowing users to define key metrics and KPIs once. These definitions can then be reused across all dashboards, charts, and reports, ensuring that every team in the organization is referencing the same reliable data.
Can I customize the visualizations in Fusedash?
Yes, Fusedash offers extensive customization options for visualizations. Users can adjust layouts, filters, and time ranges to create tailored views that meet the specific needs of different stakeholders.
Is Fusedash suitable for non-technical users?
Absolutely. Fusedash is designed to be user-friendly and accessible, even for those without technical backgrounds. With features like AI Chat and the AI Chart Generator, users can easily explore data and create visualizations without needing advanced technical skills.
StatPecker FAQ
What types of files can I upload to StatPecker?
You can upload CSV files with a maximum size of 50 MB to StatPecker for analysis. This feature allows you to extract key insights from your data without the hassle of using spreadsheets.
Is my data safe when using StatPecker?
Yes, your data remains private and secure. The Local SQL Agent feature ensures that everything runs on your device, so your data is not shared or transmitted over the internet during analysis.
Do I need any design skills to create visuals with StatPecker?
No, StatPecker is designed for users without extensive design skills. The AI-driven platform simplifies the process of creating infographics, allowing anyone to produce professional-quality visuals effortlessly.
Can I integrate my visuals into my website?
Absolutely! StatPecker allows you to publish and embed your visuals seamlessly into blogs, articles, and websites, making it easy to share your insights with a wider audience.
Alternatives
Fusedash Alternatives
Fusedash is an AI-powered data visualization platform that falls under the categories of Analytics & Data and Business Intelligence. It enables teams to transform their raw data into clear, actionable insights through decision-ready dashboards, interactive charts, and detailed reports, all within a unified workspace. Users often seek alternatives to Fusedash for various reasons, including pricing concerns, specific feature requirements, or compatibility with existing platforms. When choosing an alternative, it's essential to consider factors such as ease of use, the ability to integrate with other tools, the quality of customer support, and the overall flexibility of the platform to meet your team's unique data needs.
StatPecker Alternatives
StatPecker is an innovative AI-powered tool within the analytics and data category, designed to convert raw data into visually appealing infographics almost instantly. It helps users, including content creators, analysts, marketers, and educators, simplify the data storytelling process without needing extensive design skills. As a result, many users actively seek alternatives to StatPecker to explore different pricing options, features that may better suit their specific needs, or platforms that integrate more seamlessly with their existing workflows. When looking for an alternative to StatPecker, users should consider several factors. These include the ease of use, the quality of visual outputs, the availability of customizable features, and the overall cost. Additionally, it is essential to evaluate the level of customer support provided and how well the tool can integrate with other software commonly used in data analysis and reporting.