
LoadTester
LoadTester helps you run HTTP and API load tests from your browser or CI/CD to catch performance issues before they reach users.
Visit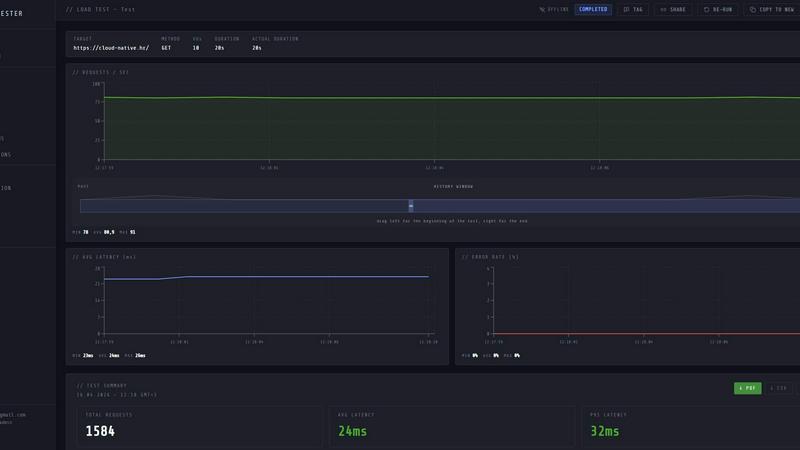
About LoadTester
LoadTester is a modern HTTP and API load testing tool built by Cloud Native d.o.o. for engineering teams that need repeatable performance checks. It helps developers and teams run HTTP and API load tests without setting up load testing infrastructure. Create a test, choose virtual users or requests per second, monitor live latency and error rates, review completed results, compare runs, and catch performance regressions before users notice. It includes exports, scheduled tests, API access, and workflow integrations for teams that want simple, repeatable performance checks. LoadTester runs distributed load tests from your browser or CI/CD pipeline, with live analytics, p95/error-rate thresholds, scheduled baselines, and run-to-run comparisons without any infrastructure to manage. The tool is built for scale, performance, and reliability, supporting up to 10,000 maximum virtual users (VUs) and 10,000 requests per second (RPS). Cold starts take less than 3 seconds from start to first request, and auto-stop thresholds help prevent runaway tests. With a typical run success rate of 99.8 percent and zero infrastructure to provision, LoadTester removes the painful parts of performance testing while keeping the workflows developers actually care about. It is designed for teams that want simple, repeatable performance checks integrated into their development lifecycle.
Features of LoadTester
Instant Execution and Distributed Workers
Start distributed load tests in seconds without any infrastructure setup, worker orchestration, or scheduling headaches. Your team focuses on results while LoadTester handles worker scaling, infrastructure coordination, and execution flow. With a cold start time of under 3 seconds and automatic worker scaling, you can dispatch up to 8 workers instantly. There is no queue time, meaning tests begin running the moment you launch them. This feature removes the complexity of provisioning servers, managing containers, or configuring distributed systems, allowing you to run application and HTTP load tests in minutes from setup to launch.
Live Analytics and Real-Time Telemetry
Watch requests, latency, failures, throughput, and bottlenecks in real time while your test is running. The live console displays key metrics including RPS, P50, P95, and P99 latency, error counts, and active virtual users. A latency distribution chart updates every 60 seconds, showing trends for p50, p95, and p99 over time. This real-time visibility means you are not waiting 5 minutes after the run to see what happened. You can monitor live latency and error rates as they happen, making it possible to spot issues immediately and take action before the test completes.
Smart Auto-Stop and Thresholds
Set failure or latency thresholds and automatically stop tests when things go sideways. LoadTester supports P95 latency thresholds with auto-stop on breach, error rate thresholds with auto-stop on breach, regression detection against baselines with Slack and email notifications for 15 percent increases, and webhook completion hooks that post result links to release bots. These guardrails prevent runaway tests from wasting resources and alert your team immediately when performance degrades. You can ship with confidence and prove capacity before launch, knowing that tests will stop automatically if they exceed acceptable limits.
CI/CD Ready Integrations and Automation
Run tests on every deploy with full CI/CD pipeline integration. LoadTester includes webhooks, Slack and email alerts, and API access for workflow integrations. You can schedule tests to run daily at specific times, such as nightly release gates. The tool supports exporting results as PDF, CSV, or JSON for sharing with your team. These automation features make it simple to include performance checks as part of your regular development workflow, catching regressions before users notice. The API access allows you to trigger tests programmatically from your deployment scripts or monitoring tools.
Use Cases of LoadTester
Spike Testing for E-Commerce Checkout Flows
Run spike tests against critical endpoints like checkout APIs to ensure your application can handle sudden traffic surges. For example, you can create a test targeting your checkout endpoint with 500 requests per second over 300 seconds. Watch live metrics like RPS, P95 latency, and error rates to see how your system behaves under load. Set auto-stop thresholds to halt the test if P95 latency exceeds 400 milliseconds or if the error rate goes above 2 percent. This use case helps e-commerce teams validate capacity before major sales events and catch performance regressions before they impact real customers.
Baseline Performance Monitoring for API Endpoints
Establish performance baselines for your key API endpoints and monitor them over time. Create tests for endpoints like authentication or search, run them daily, and compare results across runs. LoadTester supports regression detection against baselines, notifying your team via Slack or email if latency increases by 15 percent or more. This use case is essential for teams that want to catch gradual performance degradation before it becomes a critical issue. Scheduled tests run automatically at set times, such as 02:00 UTC daily, ensuring consistent monitoring without manual intervention.
Pre-Deployment Release Gates in CI/CD Pipelines
Integrate load tests into your CI/CD pipeline as release gates that must pass before deployment proceeds. Use the API access to trigger a load test automatically after every build or deployment. Set strict thresholds for P95 latency and error rates, and configure webhooks to post the result link to your release bot. If the test fails, the pipeline stops, preventing underperforming code from reaching production. This use case gives development teams confidence that new changes do not introduce performance regressions, making performance testing a standard part of the deployment process.
Capacity Planning for New Features and Services
When launching a new feature or service, use LoadTester to determine its capacity limits before going live. Run tests with increasing numbers of virtual users or requests per second to find the breaking point. Monitor live analytics to identify bottlenecks in real time, such as high latency at specific throughput levels. Use the clear summary of total requests, average latency, p95, data sent, and data received to document capacity findings. Shareable exports in PDF, CSV, or JSON format make it easy to communicate results to stakeholders and inform infrastructure scaling decisions.
Frequently Asked Questions
How do I start a load test with LoadTester?
Starting a load test is simple and takes only a few steps. First, create a new test by giving it a name, selecting the HTTP method (GET, POST, PUT, DELETE), and entering the target URL. Then choose your mode: virtual users (VUs) or requests per second (RPS). Set the rate and duration for your test. Finally, click the run button to launch the test instantly. Distributed workers are dispatched automatically with no infrastructure setup required. You will see live metrics within seconds, including RPS, P95 latency, error counts, and active virtual users.
What metrics can I see during a live test?
During a live test, you can see a comprehensive set of real-time metrics. The main display shows current RPS with trend indicators, P50 latency, P95 latency, P99 latency, and total error count. A latency distribution chart updates every 60 seconds, showing p50, p95, and p99 trends over time. You also see the total number of requests completed, total errors, number of active workers, and the current test status. After the test completes, you get a clear summary including total requests, average latency, p95, data sent, and data received.
Can I schedule tests to run automatically?
Yes, LoadTester supports scheduled tests that run automatically at specified times. You can configure tests to run daily, for example at 02:00 UTC for nightly release gates. Scheduled tests appear in the test list with their next run time indicated. This feature is ideal for baseline performance monitoring and regression detection. When combined with threshold alerts and webhook integrations, scheduled tests provide continuous performance oversight without requiring manual intervention from your team.
How does LoadTester handle test failures and thresholds?
LoadTester provides smart auto-stop capabilities based on configurable thresholds. You can set P95 latency thresholds that automatically stop the test if exceeded, error rate thresholds that halt the test above a certain percentage, and regression detection against baselines that triggers Slack and email notifications. You can also configure webhooks on completion to post result links to release bots. These guardrails prevent runaway tests, save resources, and ensure your team is immediately notified when performance degrades beyond acceptable limits.
Similar to LoadTester


The Growth Toolkit for App Store & Google Play. Create the store assets that make your app feel ready to ship.


Pay-as-you-go e-signature API and no-code sending. €0.049 per envelope, no monthly minimums, legally valid in 55+ countries.

Ornold MCP lets AI agents control Chromium and antidetect browsers: click, type, read screens, record workflows, replay profiles without scripts.


Managed remote build cache for Nx, Lerna, Turbo, Gradle, and Bazel. Reuse artifacts across CI and developer machines.

AIQualityHQ is a free browser-based tool that instantly evaluates your AI prompts for structure, safety, privacy, and accuracy.