Dividend Data vs Portfolio Genius
Side-by-side comparison to help you choose the right product.
Dividend Data
Dividend Data delivers automated stock data and decades of history directly into your Google Sheets or Excel spreadsheets.
Last updated: March 11, 2026
Portfolio Genius
Portfolio Genius is an AI advisor that analyzes your investments and suggests smarter trades.
Last updated: March 1, 2026
Visual Comparison
Dividend Data

Portfolio Genius
Feature Comparison
Dividend Data
Comprehensive Spreadsheet Functions
Dividend Data provides 16 custom functions tailored for in-depth stock analysis directly within your spreadsheet. Formulas like DIVIDENDDATA_DIVIDENDS, DIVIDENDDATA_RATIOS, and DIVIDENDDATA_QUOTE allow you to retrieve specific data points such as forward yield, ex-dividend dates, P/E ratios, and current stock prices instantly. This transforms static spreadsheets into dynamic, auto-updating financial models, saving hours of manual data collection and ensuring your analysis is always based on the latest available information.
Extensive Historical Data Library
The platform offers an unparalleled depth of historical financial data, covering over 80,000 global tickers with more than 30 years of market history. This allows investors to conduct robust long-term trend analysis, calculate multi-year dividend growth rates, examine financial performance across market cycles, and backtest investment strategies. Having decades of data at your fingertips is foundational for making informed, evidence-based investment decisions rather than relying on short-term trends.
Dual-Platform Compatibility
Dividend Data works seamlessly in both Google Sheets and Microsoft Excel, catering to the preferred workflow of every investor. The Google Sheets add-on is available on the Google Workspace Marketplace, and the Microsoft Excel add-in is listed on Microsoft AppSource. This cross-platform functionality ensures that whether you collaborate in the cloud with Sheets or prefer the advanced capabilities of desktop Excel, your access to live financial data remains consistent and reliable.
Free Tier with Generous Credits
A key differentiator is the accessible free forever plan, which provides 2,500 credits per month without requiring a credit card or facing a trial expiration. This allows new users to thoroughly test the platform's capabilities and individual investors to perform a significant amount of monthly analysis at no cost. It lowers the barrier to entry for high-quality data, aligning with the mission to serve fundamental investors who need professional tools without a professional budget.
Portfolio Genius
AI-Powered Portfolio Analysis
This foundational feature provides continuous, 24/7 analysis of your investment portfolio. The AI integrates multiple data sources, including real-time prices, company financials, and processed market news, to evaluate your holdings. It then delivers data-driven insights tailored to your stated risk profile and current market conditions, helping you understand the strengths, weaknesses, and opportunities within your portfolio without emotional bias.
Multi-Model AI Flexibility
Portfolio Genius recognizes that different investment strategies may benefit from different analytical approaches. Therefore, it offers flexibility by allowing you to choose from various advanced AI models, such as GPT, Claude, or Gemini, to generate insights and trade suggestions. This means you can select the model whose reasoning and analytical style best align with your personal investment philosophy and goals.
Smart Trade Management & Suggestions
The platform goes beyond simple tracking by providing intelligent, reasoned trade suggestions. For each potential buy, sell, or hold decision, the AI explains the underlying rationale based on its analysis of trends, news, and your portfolio's context. This educational approach helps you learn the "why" behind investment moves. You can then choose to execute these suggestions manually or, for supported brokerages, utilize automated trading.
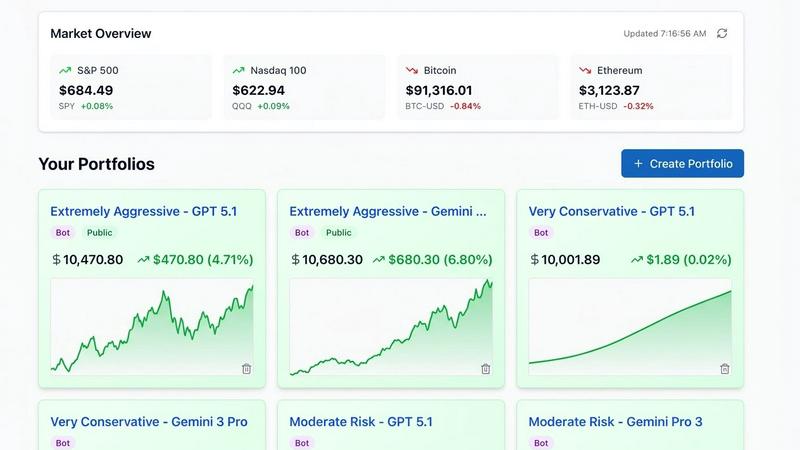
Real-Time Analytics & Global Market Tracking
You gain access to a unified dashboard that displays live market data and comprehensive performance metrics for all your holdings. This feature allows you to track a diverse range of assets, including stocks, ETFs, and cryptocurrencies from major global exchanges, in one place. Coupled with visual tools for portfolio diversification, it provides a clear, real-time picture of your asset allocation and overall financial health.
Use Cases
Dividend Data
Building a Dividend Growth Screener
Investors can use Dividend Data functions to create a custom stock screening spreadsheet. By pulling data like dividend yield, payout ratio, 5-year dividend growth rate, and PE ratio for a watchlist, you can filter and rank companies based on your specific criteria for quality and value. This automates the initial research phase, allowing you to quickly identify potential investment candidates that meet your disciplined strategy directly within a familiar, customizable environment.
Automating Portfolio Tracking and Analysis
Manually updating a portfolio spreadsheet with current prices, dividend payments, and yield-on-cost is a repetitive task. With Dividend Data, you can link your holdings to live data feeds. Formulas can automatically pull the latest price to calculate current value, fetch declared dividends to forecast income, and update key ratios to monitor the financial health of your holdings, giving you a real-time dashboard of your investment performance.
Conducting Deep Fundamental Research
When analyzing a specific company, you need consolidated access to its financial statements and key metrics. Using Dividend Data, you can build a detailed research model in a spreadsheet that pulls in annual and quarterly income statements, balance sheets, cash flow statements, and dozens of profitability, liquidity, and leverage ratios. This creates a single source of truth for your analysis, enabling you to evaluate business performance and valuation thoroughly.
Educational Modeling and Backtesting
For investors learning fundamental analysis or testing investment theories, Dividend Data serves as an excellent educational tool. You can build historical models to see how a company's stock price correlated with its earnings growth over time, or reconstruct a dividend aristocrat's payout history to study its consistency. This hands-on access to real data reinforces investment principles and allows for practical, data-driven learning.
Portfolio Genius
For Beginner Investors Learning the Basics
New investors can use Portfolio Genius as an educational tool to understand portfolio construction. By inputting hypothetical investment goals and amounts, they can see how AI analyzes different assets and suggests a diversified portfolio. The platform's clear insights and explanations for each suggestion help demystify concepts like asset allocation, risk, and market analysis, providing a strong foundational learning experience.
For Busy Professionals Needing Portfolio Oversight
Professionals with demanding careers who cannot monitor the markets daily benefit from the platform's 24/7 analysis. Portfolio Genius acts as a constant watchdog, analyzing news and performance shifts. It delivers periodic reviews and alert-based suggestions, enabling the investor to make timely, informed decisions during their limited available time without having to conduct deep research themselves.
For Experienced Traders Seeking AI-Backed Validation
Seasoned investors and active traders can use Portfolio Genius to pressure-test their own strategies. By comparing their personal analysis against the AI's data-driven insights and trade rationales from different models (GPT, Claude, etc.), they can identify potential blind spots, confirm their theses, or discover new angles, effectively using the tool as a sophisticated, unbiased research assistant.
For Portfolio Comparison and Strategy Evaluation
Investors interested in benchmarking their performance can utilize the public Portfolio Leaderboards. This feature allows users to watch and compare AI-managed portfolios with different risk profiles (Aggressive, Moderate, Conservative) competing in real-time. It provides a practical way to evaluate various investment approaches and understand how different strategies perform under current market conditions.
Overview
About Dividend Data
Dividend Data is a powerful financial data platform designed to bring institutional-grade stock market information directly into the tools investors already use every day: Google Sheets and Microsoft Excel. At its core, it eliminates the tedious, error-prone process of manually copying and pasting data from financial websites. Instead, it provides a suite of simple, custom spreadsheet formulas that pull live, accurate data directly into your cells with a single keystroke. Built specifically for dividend and fundamental investors by a fellow investor, the service grants instant access to over 30 years of historical data for more than 80,000 tickers. This includes critical metrics like dividend amounts, yields, payout ratios, growth rates, full financial statements, earnings, valuation ratios, and price history—over 100 data points in total. Its standout value proposition is democratizing high-quality data; it offers a permanently free tier with 2,500 monthly credits, requiring no API keys or coding knowledge. This makes sophisticated stock analysis accessible to individual investors without the complex infrastructure or high costs typically associated with professional financial data feeds.
About Portfolio Genius
Portfolio Genius is an AI-powered portfolio management tool designed to help investors of all experience levels make more informed decisions. At its core, it is a smart portfolio tracker that continuously analyzes your holdings, market data, and financial news to provide clear, data-driven insights. The platform's fundamental purpose is to simplify the complex world of investing by offering educational analysis and actionable information, not automated investment advice. It is built for a wide range of users: from beginners who need guidance understanding their portfolio's composition and performance, to busy professionals who lack the time for constant market monitoring, and even experienced traders seeking an AI-powered second opinion on their strategy. Its main value proposition lies in democratizing sophisticated portfolio analytics. By offering real-time performance metrics, smart trade suggestions with reasoning, and tools to visualize diversification, Portfolio Genius empowers you to take control of your financial future with greater confidence and clarity, starting with a free trial that requires no signup.
Frequently Asked Questions
Dividend Data FAQ
How does the free tier work and what are credits?
The free tier provides 2,500 credits each month, which renew automatically. Credits are consumed each time a Dividend Data formula recalculates in your spreadsheet. A simple formula fetching one data point, like a current price, typically uses one credit. More complex historical data requests may use slightly more. This system allows you to perform substantial analysis for free, and you can monitor your usage within your account dashboard.
Do I need to know how to code or set up an API?
No coding or API setup is required. Dividend Data is designed for simplicity. After installing the add-in for Google Sheets or Excel, you simply use the custom formulas like any native spreadsheet function. You type =DIVIDENDDATA_QUOTE("TICKER", "price") and the live data appears. The platform handles all the complex data connections and updates in the background for you.
What kind of data can I access with the spreadsheet functions?
You can access a wide array of data points crucial for fundamental and dividend investing. This includes dividend dates and amounts, forward yield, payout ratios, dividend growth rates, full financial statements (income, balance sheet, cash flow), key ratios (P/E, P/B, Debt/Equity), earnings metrics, real-time and historical prices, market capitalization, and over 100 other specific metrics. The documentation provides a complete list of all available functions and arguments.
Is my data secure and private?
Yes. Dividend Data uses secure, encrypted connections for all data transfers. Importantly, when you use the spreadsheet add-ins, your stock tickers and data requests are processed securely, but your personal portfolio holdings and spreadsheet contents are not stored or accessible on Dividend Data's servers. Your financial models and private data remain within your own spreadsheet files.
Portfolio Genius FAQ
Does Portfolio Genius provide investment advice?
No. Portfolio Genius is strictly a portfolio tracking and analytics platform. It provides educational and informational analysis based on market data and algorithms. The insights, analytics, and trade suggestions are for informational purposes only to help you make your own decisions. It is not a registered investment advisor and does not provide personalized financial or investment advice.
How does the AI generate its analysis and suggestions?
The AI system integrates and processes data from multiple reliable sources. This includes real-time pricing services, fundamental company financial data, AI-processed news for market sentiment, and broader web search for the latest research and reports. By synthesizing this information, it analyzes your portfolio's holdings and the market context to generate its performance insights and reasoned trade suggestions.
Can I try Portfolio Genius for free?
Yes. You can start using Portfolio Genius immediately with a free, no-signup-required demonstration. This allows you to describe your investment interests and explore how the AI analyzes and constructs portfolios. For continued use, all paid plans include a full 7-day free trial, giving you complete access to the platform's features before any subscription charges apply.
Is my financial data secure on the platform?
Yes. Portfolio Genius employs bank-grade, enterprise-level security standards to protect your data. All sensitive information is encrypted, and the platform is built with robust security protocols. This ensures that your portfolio data and any connected account information (if you choose to integrate a brokerage) are kept safe and confidential.
Alternatives
Dividend Data Alternatives
Dividend Data is a specialized financial data service that provides historical and current stock market information directly within spreadsheet applications like Google Sheets and Excel. It falls into the category of fundamental investment research tools, designed specifically to streamline analysis for income-focused investors. Users often seek alternatives for various reasons, including budget constraints, the need for different feature sets, or compatibility with other platforms like proprietary software or different data visualization tools. When evaluating different services, it's crucial to consider your core investment strategy. A dividend growth investor will prioritize different metrics than a value or technical trader. Key factors include the depth and historical range of the financial data offered, the ease of integration into your existing workflow, and the overall cost structure relative to your usage needs. The goal is to find a tool that provides reliable, actionable data without unnecessary complexity or expense. Ultimately, the right alternative should feel like a natural extension of your research process, delivering the specific metrics you need in a format you can immediately use. It's about finding a balance between comprehensive data access, usability, and value, ensuring the tool saves you time and enhances your decision-making rather than creating more work.
Portfolio Genius Alternatives
Portfolio Genius is an AI-powered investment advisor in the business and finance category. It uses advanced algorithms to analyze markets and provide personalized trade recommendations to help users manage and grow their portfolios. Investors may look for alternatives for various reasons. These can include differences in pricing models, the need for specific features not offered, or a preference for a different platform or user experience. Every investor's needs and financial situation are unique. When evaluating other options, consider the core fundamentals. Look at the technology and methodology behind the recommendations, the level of control and automation provided, the transparency of the reasoning for suggestions, and the overall cost structure. The right tool should align with your investment knowledge, goals, and comfort level.